Electric Imp Developers:
We have just updated the IDE Public Beta to version 1.46, which is now available at https://beta-ide.electricimp.com/.
Version 1.46 includes the following new features:
<h3 id="new-features">New Features</h3>
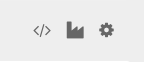
<p>IDE 1.46 features a major update to the Tab Bar, with new tabs and additional functionality:</p>
<ul>
<li>Dashboard</li>
<li>Models</li>
<li>Debug</li>
</ul>
<p>When you log into the IDE, or switch to a shared account, the tab that will be selected for you will depend on the account type. If you have a free developer account, you will go to the Models tab; if you are an Electric Imp customer, you will go to the Dashboard.</p>
<h4 id="dashboard">Dashboard</h4>
<p>IDE 1.46 sees the introduction of the Dashboard tab, which presents useful statistical information in a graphical form in the Workspace. This is only available to Electric Imp customers, and to collaborators who have access to a customer’s models and have been granted either the Admin and/or the Ops Manager role(s).</p>
<p>The Dashboard provides a set of widgets, each presenting one type of production-related data, such as the number of production devices that have been blessed and activated. Initially, the Dashboard will present three widgets covering, respectively, production data usage, production devices and factory devices, but we plan to add many more in the coming months.</p>

Models
IDE 1.46 features a new way of viewing your models and the devices assigned to them. You can now access your models from the Tab Bar’s new Models tab.

Clicking on Models presents a list of all your models in the Workspace area. A drop-down menu allows you to quickly filter the list by model type: development, production, factory or inactive.

Each model is listed by name, type, the number of device assigned to it, and the date and time at which it was last revised. Clicking on any of these column titles immediately sorts the list by that column, initially alphabetically, lowest to highest, or most recent to oldest, depending on which column you select. Click on the column header again to reverse the sort order.
When you move your mouse pointer over a model, the fifth column, Actions, will display icons representing actions you can take on that model. The possible icons represent:
- Code — view or edit the model’s agent and device code.
- Factory — view or update a production model’s factory settings.
- Settings — pop up the model’s settings panel.
To create a new model, just click the large plus sign at the top right of the Workspace.
To see which specific devices have been assigned to a model, select that model’s code and then click on the ‘Device’ drop-menu beneath the model’s name in the Workspace.
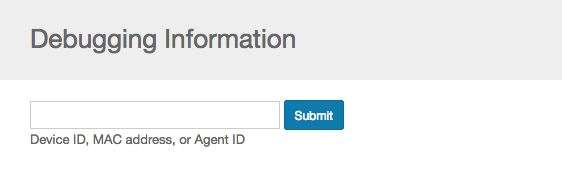
Debug
As part of our ongoing efforts to improve the look and feel of the IDE, we have moved the debugging information interface from the production model Workspace (where it appeared alongside the ‘Code’, ‘Factory’ and ‘Report’ Workspace tabs) into the Tab Bar for easier access.
Log in to the updated IDE here
As always, we welcome your feedback and comments — please post them in this forum (you can come here straight from the IDE Public Beta by clicking on the Electric Imp logo and hitting the ‘Provide Feedback’ button. Please include in the post the beta version you are testing (1.46) so we can reproduce and address your concerns accordingly.
The Electric Imp Team