I was so excited to see the sample code for the Temperature Logger. I wanted an Imp-enabled temperature sensor! After attending an intro class put on by Electric Imp staff, I realized that the Hannah board was not for sale (oso sad).
I kept thinking about how fun and handy it would be to have an online Cosm graph of real-time temperature data from wherever I wanted. How difficult would this be to accomplish with the relatively easy to get April board?
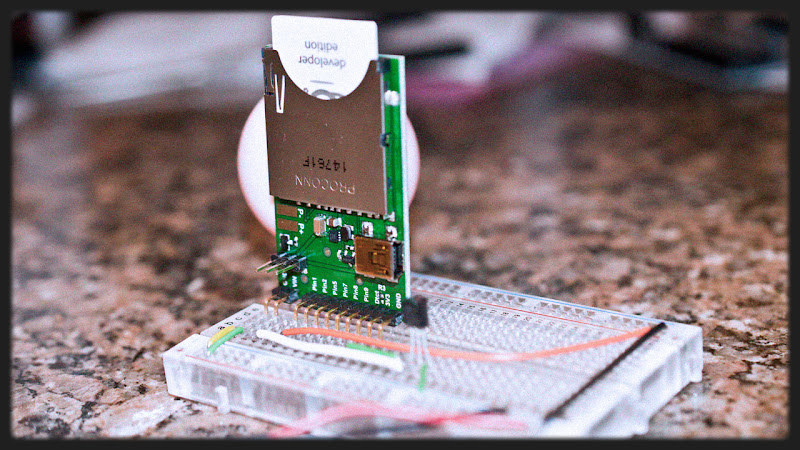
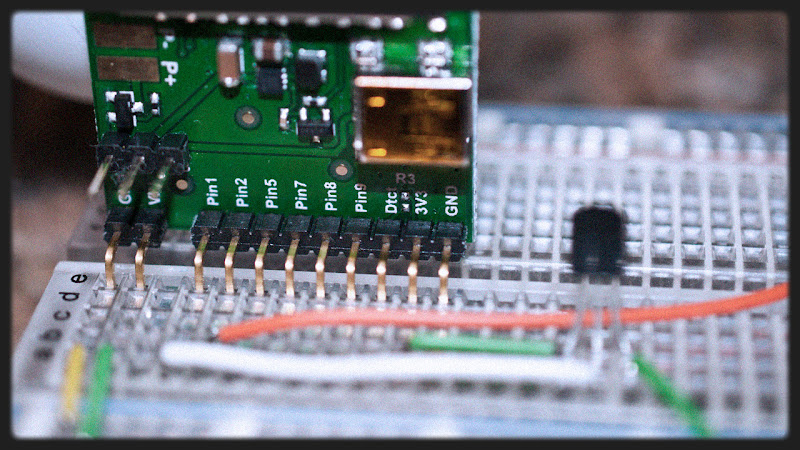
It wasn’t too bad and the temp sensor was only $2 from adafruit. I used a 6v AC/DC adapter to power the Imp and the Imp’s 3.3v pin to power the temp sensor and LED indicator light.
The unit samples the room temperature every second and gives that info to the Imp. The Imp plugs into the Cosm service via the Cosm node in the planner (add node > Cosm). For more about setting up Cosm. Cosm provides a graph to visualize the temperature data in a browser plus there is an indicator LED. The LED will indicate by color if the room is too cold, too hot or just right.
Right now it only lights up when you exceed the specified “hot” threshold. Im my case that is 70° F. The next rev I’ll have RGB signals for the RGB LED to indicate ranges of temperature. Perhaps blue for under 60, green for 61-70 and red for 70+. I will also add a pulsing emergency red PWM fader for temps over 110° F.
WOW, really nice. I’m trying to do the same thing with a thermistor? from http://devwiki.electricimp.com/doku.php?id=thermistor
I feel so stupid, I just got my Imp and April board yesterday and I have a lot to learn, I have the everything set up and the data is going to Cosm but it’s not graphing? https://cosm.com/feeds/101801
maybe it can’t work this way?
Ok, I think I got it, For some reason the original datafeed wastn’t working so I deleted it and made a new one now it’s working https://cosm.com/feeds/101984
I’ve noticed that most actions initiated in the planner have a sort of latency. I usually allow a minute or so to let the ui update. It can be misleading if you expect immediate feedback. Probably a progress indication of some sort could be helpful to the user.
For more fun, take a look at connecting xively (cosm) to zapier. You can send your xively data to zapier through triggers and then send it to all sorts of web services. SMS, Twitter, ect.